On the choice of fixed interest rate
From Prof. Dr. Gunnar StarkProfessor of Finance at the Allensbach University
Over the past decade, market participants have almost become accustomed to extremely low, sometimes negative interest rates. In the course of this year, however, interest rates have risen again considerably and the previously common phenomenon of significant interest rate differences between fixed-interest periods has returned. The market interest rate at the long end of the interest rate structure is around two percentage points higher than at the short end.
As a result, the choice of fixed interest rate - viewed here from the borrower's perspective - becomes more complex again, namely enriched by the old question: could it be worth choosing a fixed interest rate period that is shorter than the (expected) total financing period? Since we know nothing about the future of interest rates and the recent past of interest rates seems somewhat surreal, we want to take a deeper look into the history of interest rates and go back to 1968.
Gustav and Donald follow the same interest rate strategy
Old schoolmates Gustav and Donald meet up again after many years and brag to each other about their possessions and careers. Among other things, they both bought their own homes at the beginning of their careers. Gustav in January 1968, Donald three years later in January 1971. Both took out a loan of 100,000 euros from a bank to finance the purchase and made identical annuities of 9,600 euros. Both also always had the same fixed interest rate, namely 10 years. Only the interest rates to be paid by the two comrades were different due to the upward and downward movement on the German bond market and thus also the construction financing market:
Gustav agreed
- 1968 initially 7.8 %, extended
- 1978 to 7.0 % and
- 1988 to 7.5 %.
Donald began
- 1971 with 8.7 %, had to
- 1981 to 10.2 % and
- 1991 to 9.8 %.
The market average over the 30 years or so was around 8.5 %, which Gustav's personal average happily fell short of by around one percentage point (7.4 %), while Donald's was also higher by around one percentage point (9.6 %).
Gustav once again the winner
These deviations from the average result from a difference of only three years in the starting date, but cause considerable financial differences:
- At the end of his 30-year term in January 2001, Donald still owes 37,000 euros.
- Gustav, on the other hand, was already debt-free 23½ years after taking out his loan and was able to invest the EUR 9,600 he had saved each year.
The difference between Gustav's and Donald's net assets 30 years after the respective loans were taken out is therefore a good EUR 100,000, i.e. more than the original loan amount.
This difference is solely due to the different interest rates for the respective fixed interest periods.
Both adhered to a previously prominent "rule", namely to choose the longest fixed-interest period on offer - ten years - because this was "the safest".
However, this rule falls somewhat short. After all, it concentrates the interest rate rollover risk on a very specific point in time ten years away - what is safe about that?
Fixed interest rate and risk
Rather, from a stylized perspective, the following risk laws of fixed interest rates seem to apply:
- The interest rate risk is minimal with a full commitment for the entire term of the loan.
- The maximum interest rate risk is when the loan is divided into two commitment periods of approximately equal length, i.e. when two very long commitment periods are agreed.
- The risk decreases with each further reduction in the fixed interest period, but will never disappear.
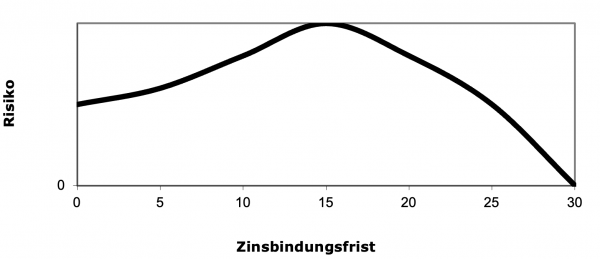
The risk of a few less long fixed-interest periods is reduced by the more frequent readjustments of short-term fixed-interest periods thanks to averaging over the various interest rate levels over time. The following figure illustrates the qualitative relationship between the fixed-interest period and risk. In addition to what has been discussed so far, it also captures the decreasing risk when dividing into a few but unequal parts if the first part is greater than half of the total period. If, for example - to pick out a radical example - the first fixed-interest period is agreed for 27 years, the risk is again very low because the subsequent interest, which depends on the interest rate level in years 27 to 30, only has to be paid for three years and a considerable part of the debt has usually already been repaid by then, meaning that it can only cause comparatively little damage even in the event of a high-interest phase.
Of course, the law described above only applies if the risk of insolvency (due to rising loan interest rates) is negligible because the assets or income offer sufficient reserves in relation to the debt volume. If there is a noticeable probability of insolvency, spreading the interest rate risk over several points in time still reduces the risk of the average interest rate on the loan being higher than the average interest rate on the market during the financing term; however, the interest rate may be so high in just one of the various fixed interest rate periods for borrowers at risk of insolvency that there is no longer any benefit from the interest rate averaging because forced liquidation occurs.
However, the short fixed-interest periods were also regularly accompanied by faster debt repayment and thus lower overall interest charges, as the final empirical analysis indicates:
Fixed interest rate and debt repayment period
The graphs below show the alternative residual debt courses for four different start years (1970, 1975, 1980 and 1984). The long fixed-interest period is represented by ten-year fixed-interest periods, which were rigidly extended by ten years on expiry, which was required twice in each case. The conditions of the fixed-interest periods therefore originate from the years 70-80-90, 75-85-95, 80-90-2000 and 84-94-04.
The annuity was increased by one percentage point in each case by increasing the interest rate from the initial fixed interest rate (initial repayment rate therefore always 1 % p.a.) and left at this level for the entire financing term.
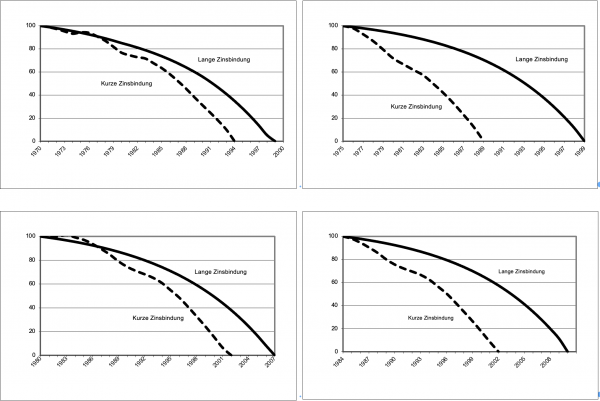
This ten-year strategy is compared with the results of a revolving one-year strategy (dashed curves), whose annuity was equated with the level of the corresponding ten-year variant. The borrower therefore generates the same cash flow to service the debt until full repayment in both strategies.
In all four selected comparative cases, the financing on the basis of the short fixed interest rate ended earlier, although in the first years of the debt repayment period, the longer fixed interest rate sometimes has lower residual debt balances, as can be seen on closer inspection in two of the four graphs. These results are a natural reflection of both the higher interest rate volatility of the short fixed-rate period and its lower average rate.
Assumptions and sources: The residual debt curves are based on one- and ten-year market interest rate data (yields on German government securities) according to Deutsche Bundesbank records (increased by one percentage point in each case to simulate a uniform bank margin).
Request information now free of charge!
You can find all the important information about your degree program in your personal study guide.